
YouTube Analytics: The Complete Creator Guide (2026)
YouTube Analytics explained for 2026: every Studio tab, the 3 metrics that predict growth, real CTR benchmarks, and a 15-minute weekly routine.
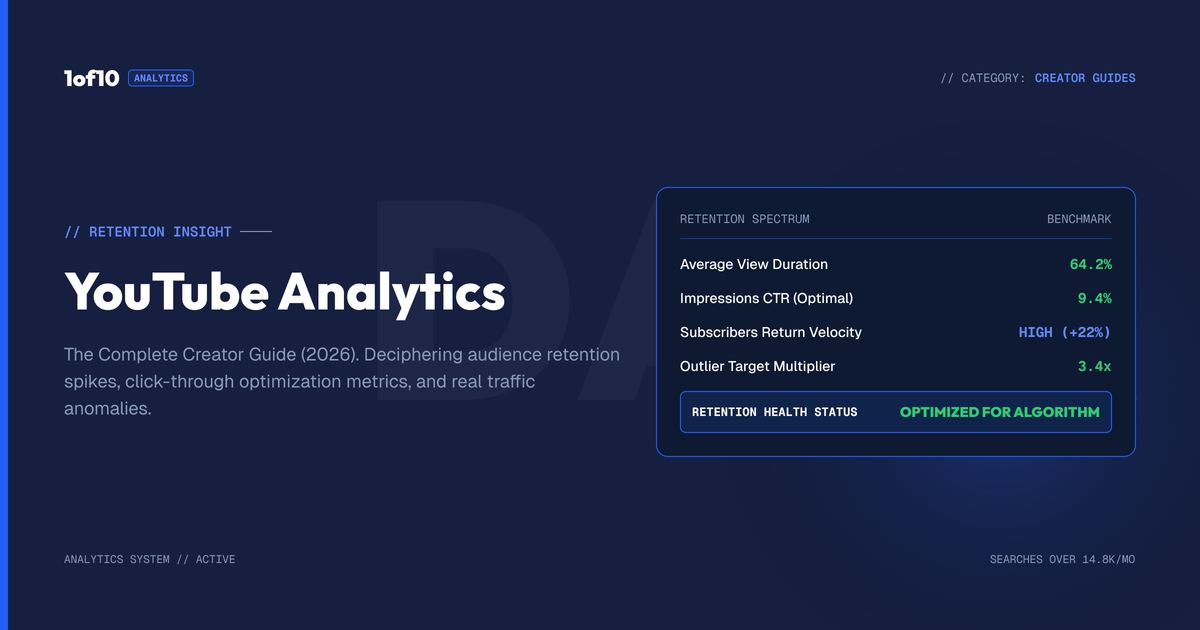
YouTube Analytics is the free reporting dashboard inside YouTube Studio that shows how your channel and videos perform. Open Studio, click Analytics in the left menu, and you get five channel-level tabs: Overview, Content, Audience, Revenue, and Trends. Three metrics inside those tabs predict growth more than everything else combined: click-through rate, average view duration, and returning viewers.
That is the short version. The long version matters because most creators read the dashboard wrong. YouTube itself reports that half of all channels see a CTR between 2% and 10%, yet creators still panic over a single video's first-hour numbers. This guide walks through every tab, flags the metrics worth your attention, flags the ones that waste it, and covers the one thing YouTube Analytics will never show you: everyone else's data.
What is YouTube Analytics?
YouTube Analytics is YouTube's built-in performance dashboard for creators. It tracks your youtube channel stats (views, watch time, subscribers, revenue) and your youtube video analytics (impressions, click-through rate, retention) across every video you have ever published. It is free, first-party, and updates in near real time for headline numbers, with full reports refreshing every 24 to 48 hours.
Two levels exist and they show different things:
- Channel level: the big picture. Tabs: Overview, Content, Audience, Revenue, Trends.
- Video level: one video under a microscope. Tabs: Overview, Reach, Engagement, Audience, Revenue.
The tab names shifted over the years, so older tutorials reference sections that no longer exist. The structure above matches YouTube Studio as of 2026, per Google's own documentation.
How to find YouTube Analytics on desktop
- Go to studio.youtube.com and sign in.
- Click Analytics in the left menu for channel-level reports.
- For a single video: click Content in the left menu, hover over the video, and click Analytics.
How to find YouTube Analytics on mobile
- Open the YouTube Studio app (not the main YouTube app).
- Tap Analytics in the bottom menu for channel stats.
- For one video: tap Content, select the video, then tap View more under the Analytics section.
The mobile app covers the essentials but Google notes some reports are desktop-only. Advanced mode, comparisons, and data export all require desktop. Treat the app as a check-in tool, not a research tool.
The 4 core tabs of YouTube Analytics, explained
At channel level, four tabs do almost all the work: Overview, Content, Audience, and Revenue. A fifth tab, Trends, surfaces search demand and content gaps, and it is worth a monthly look. Here is what each one shows, which metrics matter, and which ones you can safely ignore.
| Tab | What it answers | Priority metrics | Safe to ignore |
|---|---|---|---|
| Overview | How is the channel doing right now? | Views trend, watch time trend | Realtime counter refreshing |
| Content | How do viewers find and click my videos? | Impressions CTR, avg view duration, traffic sources | Raw impression counts in isolation |
| Audience | Who watches, and do they come back? | Returning vs new viewers, when viewers are online | Gender split (rarely actionable) |
| Revenue | What is the channel earning? | RPM, top-earning videos | CPM (advertiser-side, not yours) |
Overview tab
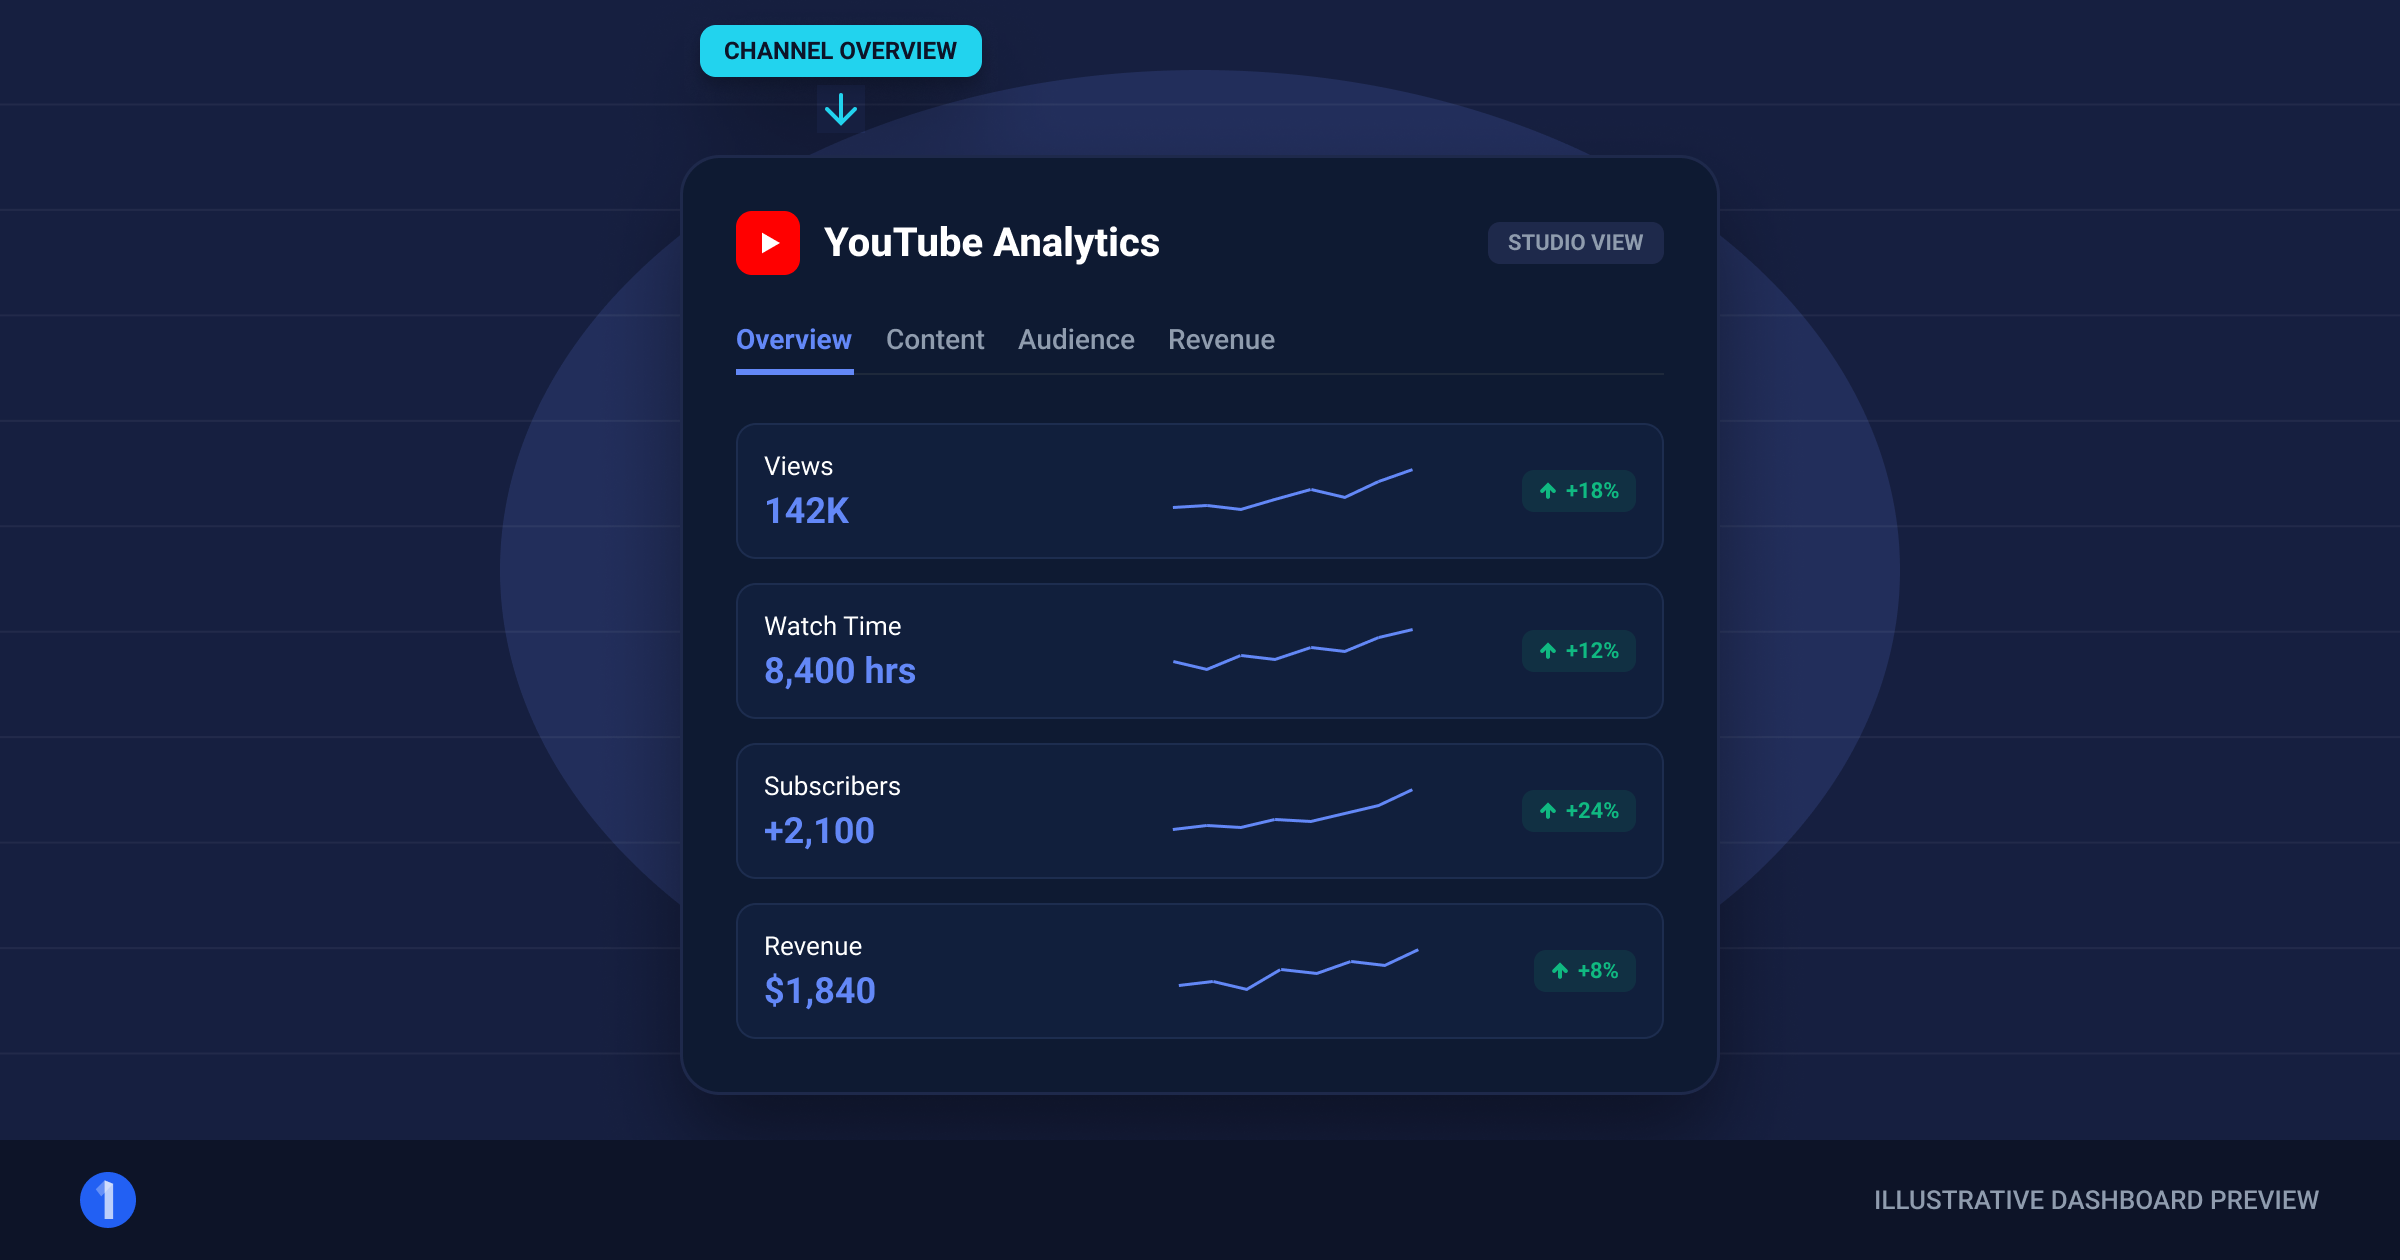
The Overview tab is your channel's vital signs: views, watch time, subscribers, and (if monetized) estimated revenue for the selected period, plus a realtime panel covering the last 48 hours.
Use it for trend direction, nothing more. The question Overview answers is "up, flat, or down versus the previous period?" It cannot tell you why. The realtime counter is the single most overwatched number in YouTube Studio; it moves constantly and means almost nothing hour to hour.
- Check the period-over-period comparison, not the raw totals.
- Spikes usually trace to one video. Click through to find it.
- "Typical performance" ranges on new uploads beat raw view counts for judging a launch.
Content tab
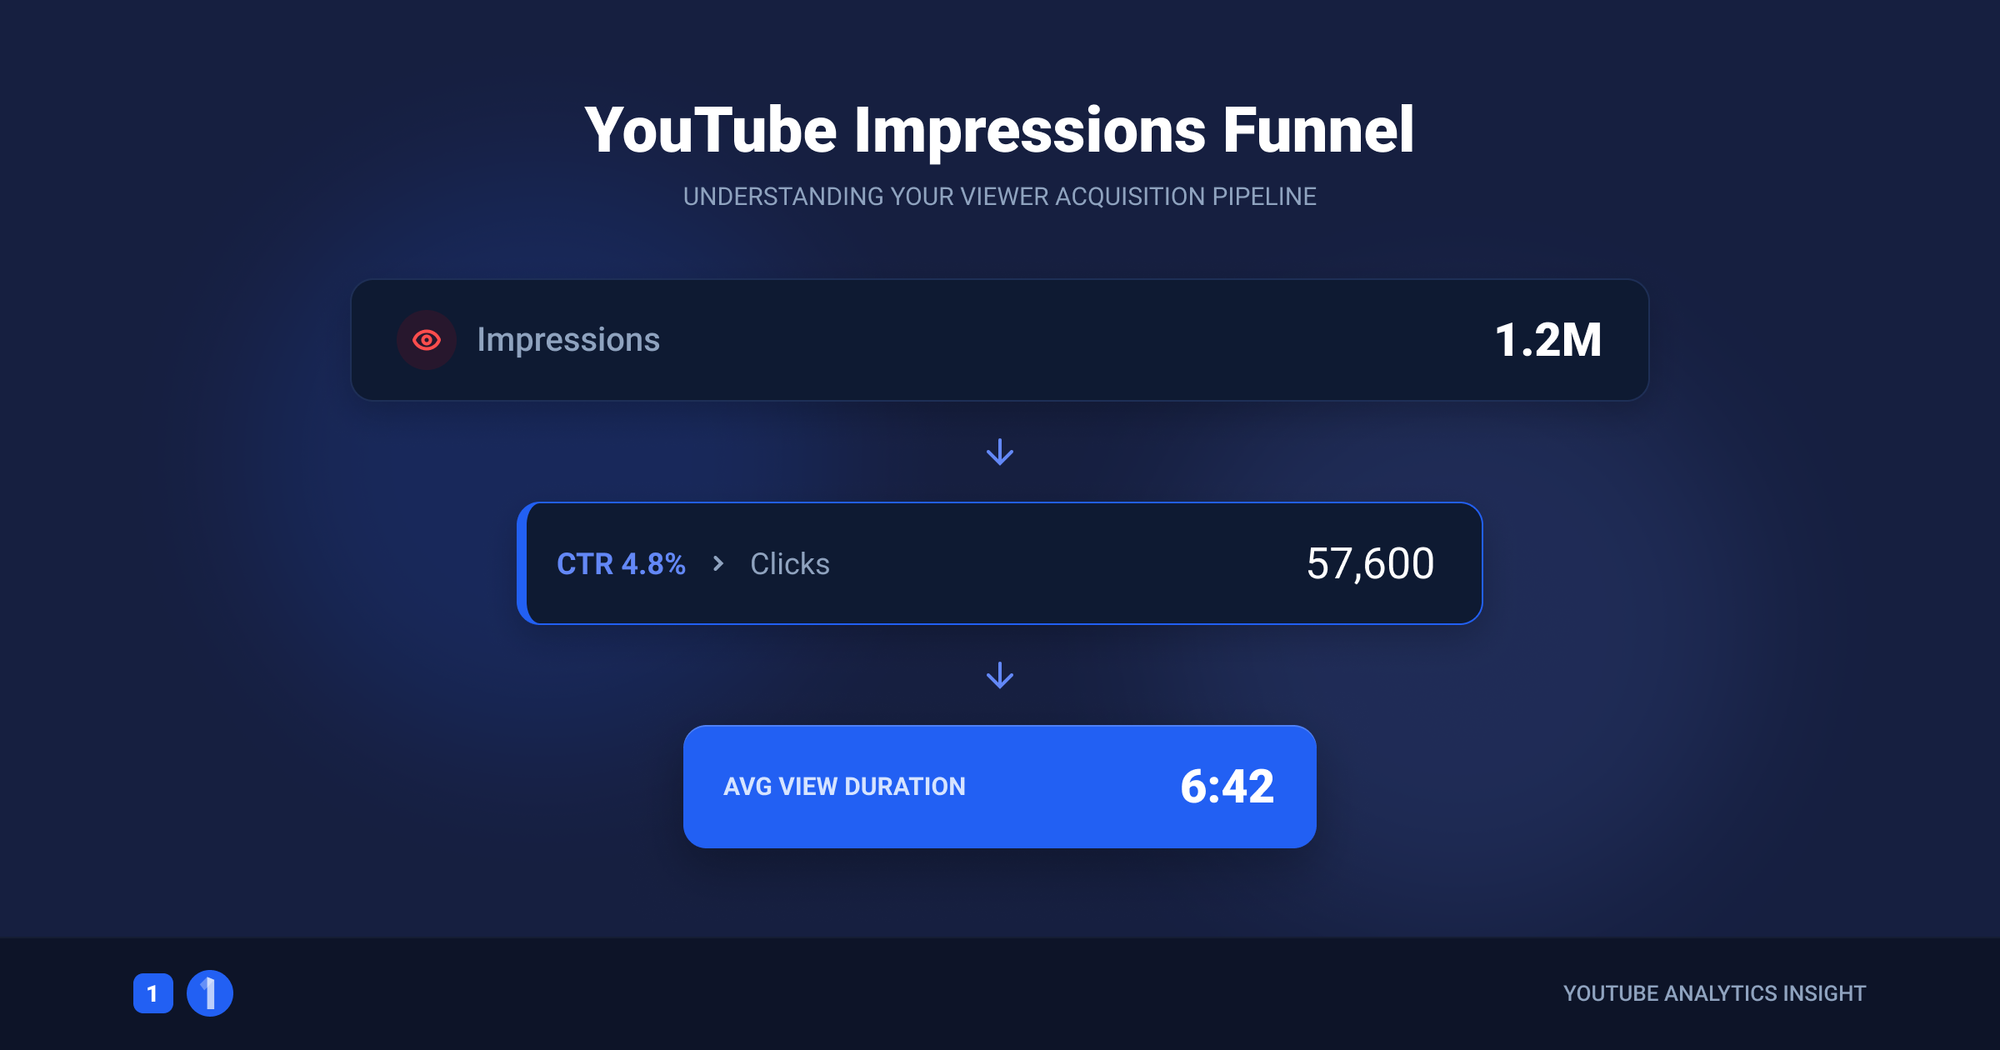
The Content tab shows how viewers found your videos and what they did next: impressions, impressions click-through rate, views, and average view duration for every upload. Google describes it as showing "impressions and how they led to watch time," which is exactly the funnel you should read it as.
This is the highest-value tab in YouTube Analytics for growth decisions because it holds both packaging metrics (impressions, CTR) and content metrics (average view duration).
At the individual video level this splits into two tabs:
- Reach: impressions, CTR, traffic sources, unique viewers. How the video got seen.
- Engagement: watch time, average view duration, the retention graph, key moments. What happened after the click.
The retention graph deserves its own ritual. The first 30 seconds show your hook strength. Sharp cliffs mid-video mark the exact moment people left. Bumps mark moments people rewatched. No other report tells you where to improve the actual video.
Audience tab
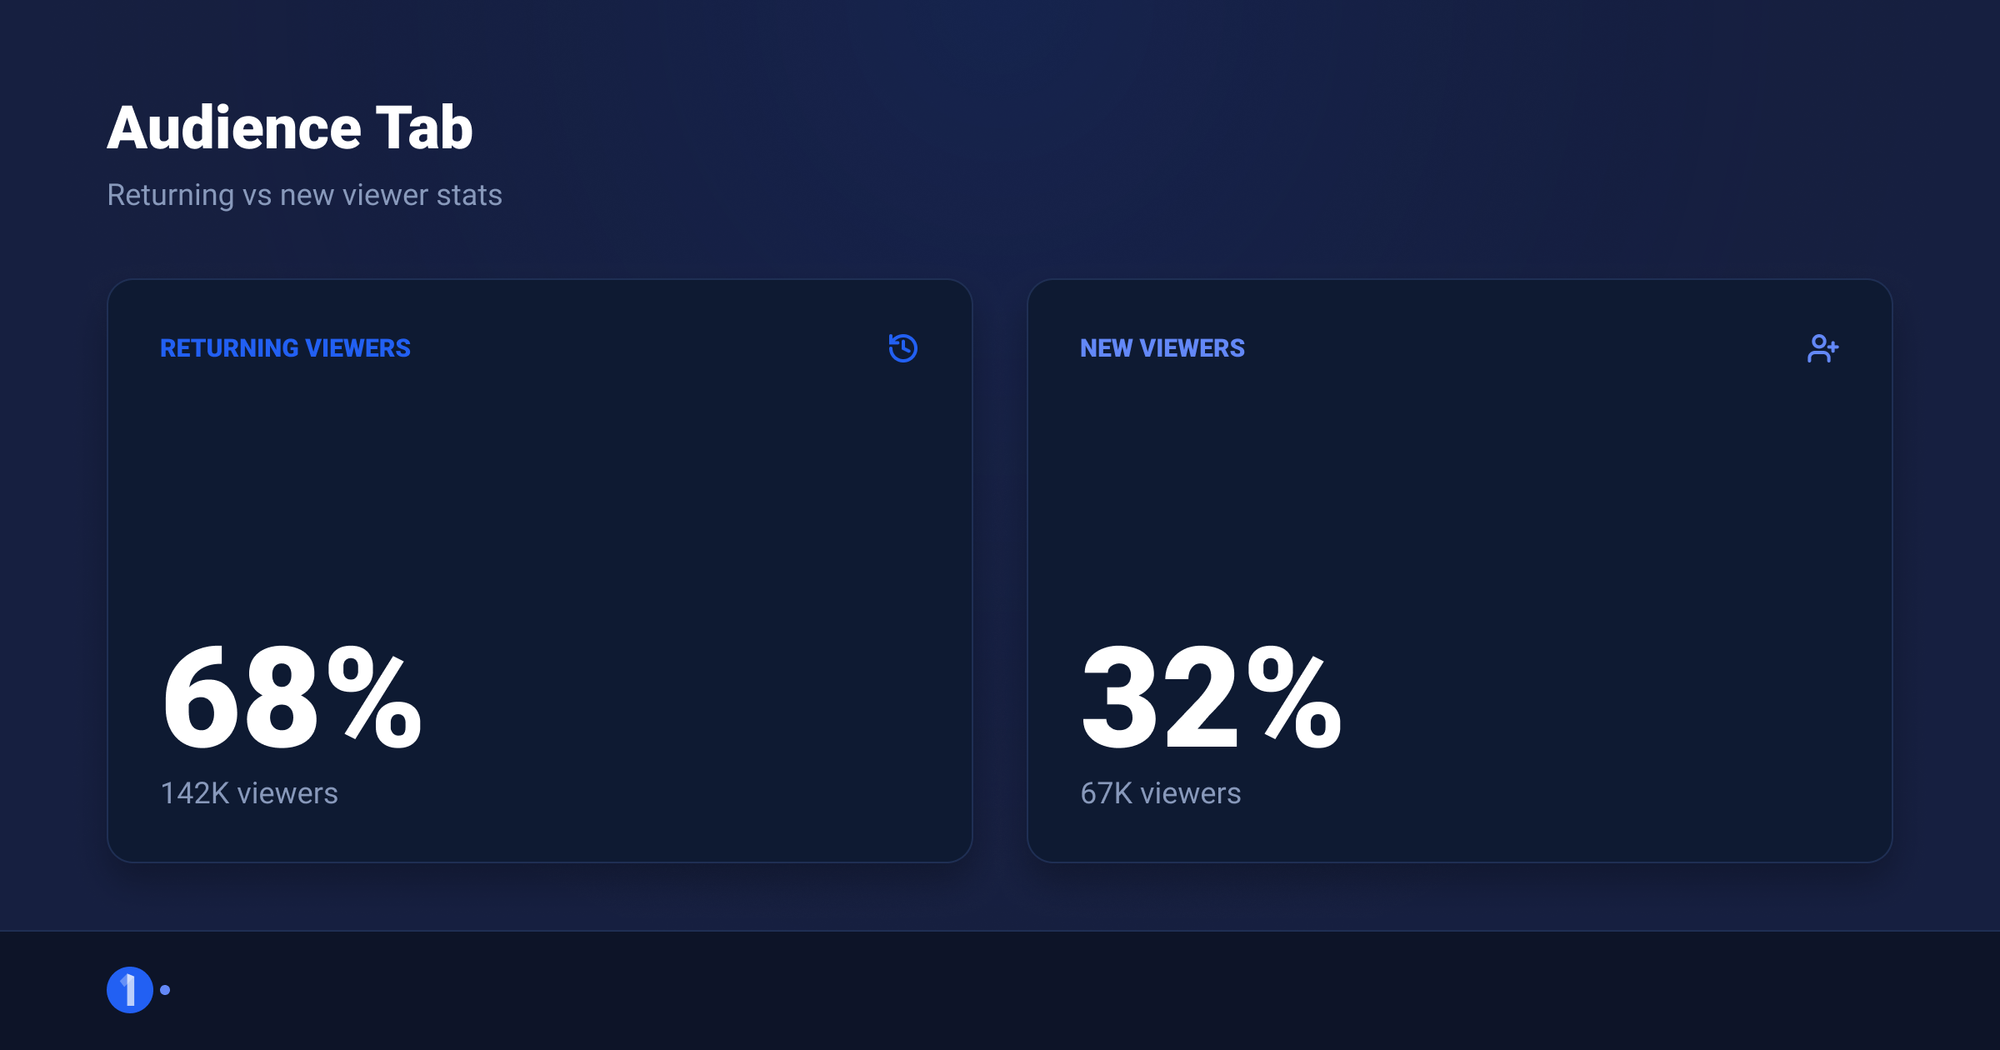
The Audience tab answers who watches and whether they return: returning viewers, new viewers, unique viewers, subscriber counts, demographics, geography, and two underused reports: "When your viewers are on YouTube" and what else your audience watches.
Google's definitions are precise here. New viewers are "viewers who watched something on your channel for the first time in the selected time period." Returning viewers "have watched your channel previously and returned to watch more." That split is the closest thing YouTube gives you to a loyalty score.
- Returning vs new viewers: the ratio matters more than either number. All new and no returning means content that gets clicked but builds no habit.
- When your viewers are on YouTube: use it to time uploads, then stop rechecking it weekly. It barely moves.
- Other channels your audience watches: free competitor intel. Note these channels; they matter again in the competitor section below.
- Demographics: interesting, rarely actionable. Only act on it if the data contradicts who you think you make videos for.
Revenue tab
The Revenue tab appears for YouTube Partner Program members and shows estimated revenue, RPM, CPM, monthly estimates, top-earning videos, and revenue sources (ads, memberships, Premium, Super Thanks).
Two numbers get confused constantly:
- CPM: what advertisers pay per 1,000 ad impressions, before YouTube's cut, counting only monetized views.
- RPM: what you earn per 1,000 total views, after YouTube's cut, across all revenue sources.
RPM is your number. CPM is the advertiser's. If you want one revenue metric to track monthly, track RPM, and watch which formats and topics your top-earning videos share. Ignore day-to-day revenue wobble; advertiser demand swings by season (Q4 up, January down) regardless of anything you did.
Trends tab (the fifth one)
The Trends tab, at channel level, shows what your audience and similar audiences are searching for, plus content gaps: searches with high demand and thin supply. It is idea fuel, not performance reporting. Check it when planning, not when reviewing. For a deeper idea pipeline built on actual outlier performance rather than search phrases, that job belongs to external tools, covered below.
The 3 metrics that actually predict growth
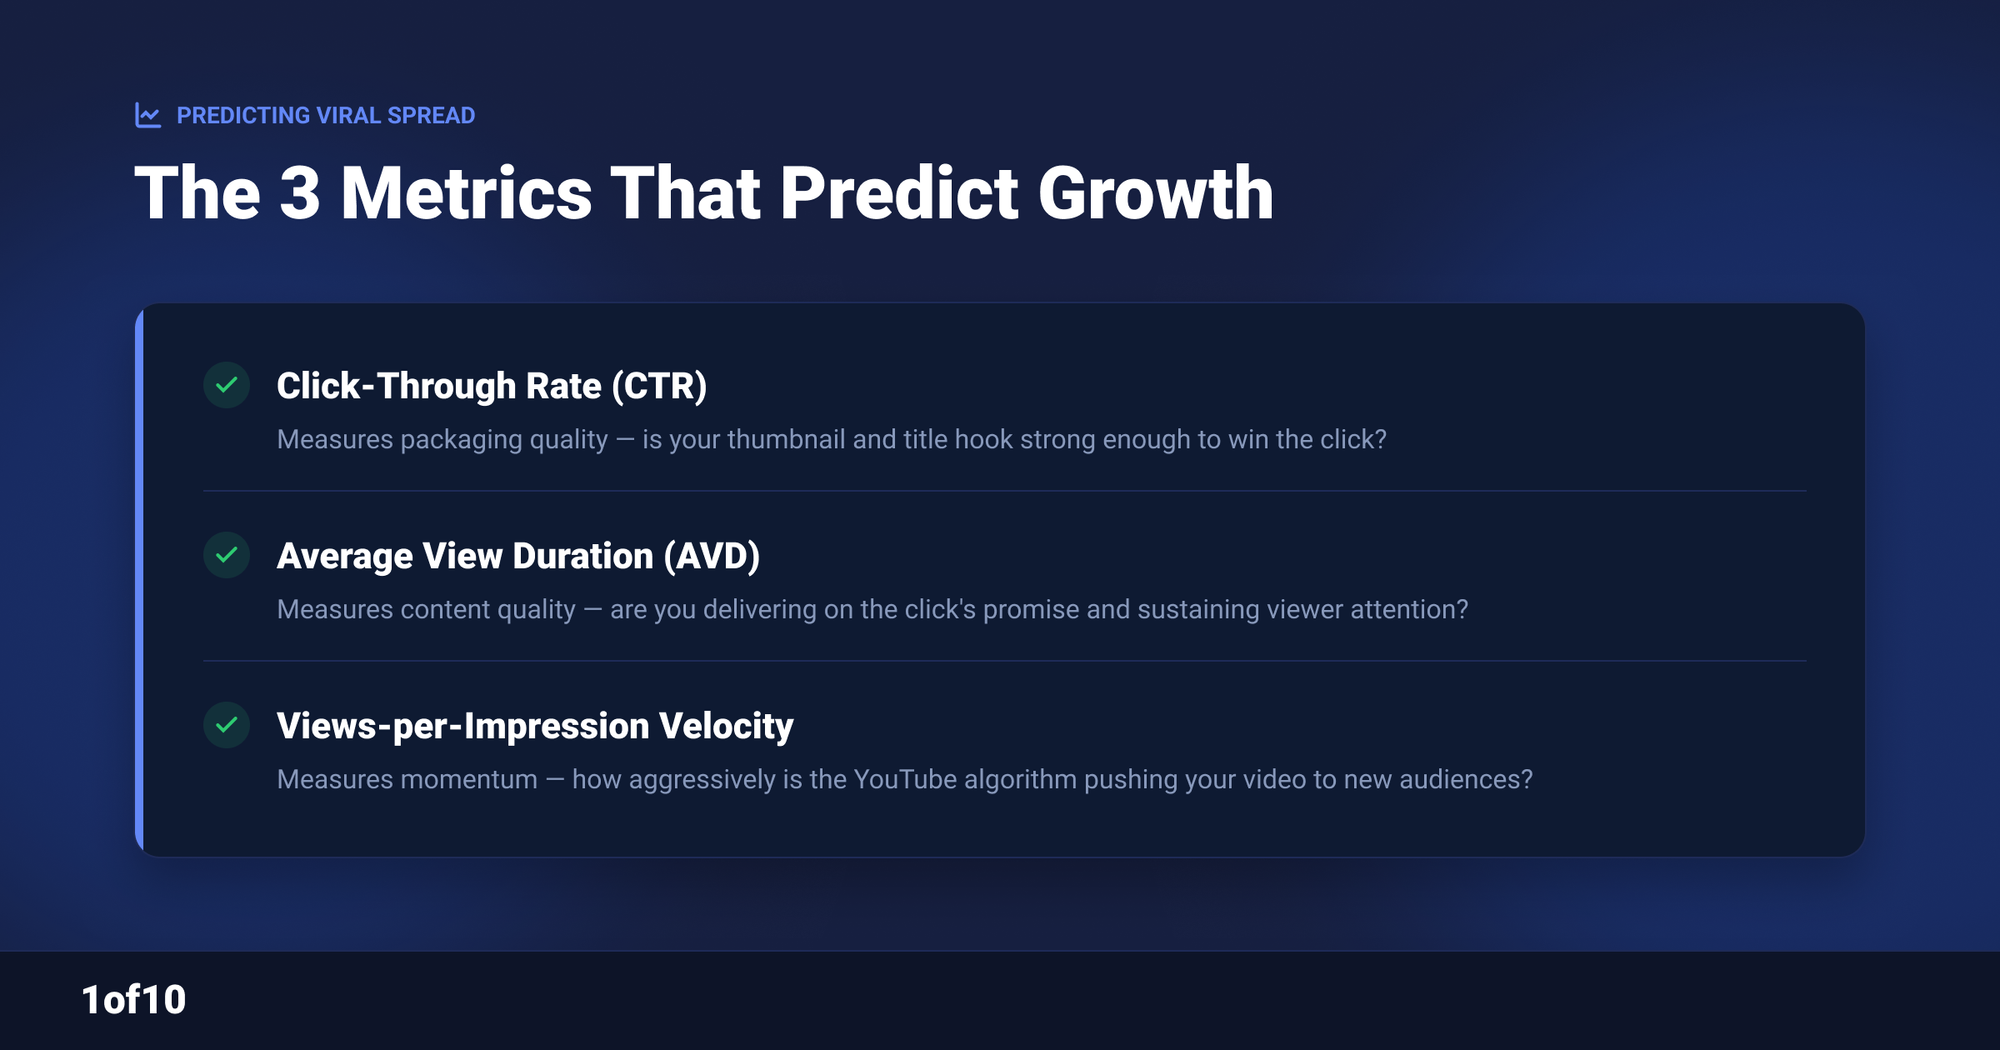
Every metric in YouTube Analytics describes the past. Only a few predict the future. Across everything the dashboard reports, three deserve standing attention: impressions click-through rate, average view duration, and returning viewers.
Impressions click-through rate (CTR)
CTR is the percentage of impressions that turned into views. YouTube's official guidance: half of all channels and videos land between 2% and 10%. It measures one thing: how compelling your title and thumbnail are to the audience YouTube showed them to.
Three caveats stop most CTR misreads:
- CTR falls as impressions rise. A video pushed to the broad homepage audience will click lower than one shown mostly to subscribers. Falling CTR with rising views is often success, not failure.
- Videos under a week old or under 100 views have unstable CTR. Do not judge yet.
- Where the impression happened changes everything. Browse, search, and suggested each click differently.
We keep a full breakdown of what counts as good, by channel size and niche, in our guide to a good click-through rate on YouTube, and tactical fixes in how to boost your CTR. This pillar will not re-litigate the benchmarks; the short answer is that your own channel average is the only baseline that matters.
Average view duration (AVD) and retention
Average view duration is, in Google's words, "average minutes watched among those who stayed to watch." It is the content-quality half of the growth equation. CTR gets the click; AVD proves the click was deserved.
Read AVD two ways:
- Absolute: an 8-minute AVD on a 10-minute video is elite. The same 8 minutes on a 40-minute video needs work.
- As retention percentage: compare videos of similar length only. Comparing a Short's retention to a 30-minute documentary tells you nothing.
AVD feeds directly into watch time, the currency the recommendation system optimizes for. If retention is your weak metric, start with our guide to YouTube watch time.
Returning viewers
Returning viewers are the compounding metric. New viewers cost impressions to acquire; returning viewers show up on their own and click at higher rates, which trains the algorithm to trust your uploads faster. Channels that grow for years share one stat pattern: returning viewers grow every quarter even when views wobble.
The growth loop: impressions to CTR to AVD to more impressions
These metrics form a loop, and the loop is how YouTube actually decides distribution:
- Impressions: YouTube tests your video with a slice of viewers.
- CTR: enough of them click, and the packaging passes.
- AVD: they stay and watch, and the content passes.
- More impressions: YouTube widens the test to a bigger, broader audience.
- The cycle repeats at each new audience tier, and CTR usually dips as the audience broadens. That is the loop working, not breaking.
A video only needs to fail one stage for distribution to stall. High CTR with low AVD means the thumbnail wrote a check the video did not cash. Low CTR with high AVD means a great video wearing bad packaging. The loop tells you which half to fix, which is the entire diagnostic value of youtube analytics in one sentence. The mechanics behind this are covered in how the YouTube algorithm works.
Benchmarks: what counts as "good" in YouTube Analytics?
Creators want a number to beat. YouTube publishes exactly one: half of channels see CTR between 2% and 10%. Everything else varies so much by niche, video age, and audience size that universal benchmarks mislead more than they help.
| Metric | Published reference point | The honest benchmark |
|---|---|---|
| Impressions CTR | 2% to 10% covers half of YouTube (Google) | Your channel's trailing average |
| Average view duration | None published | Your own recent videos of similar length |
| Retention at 30 seconds | None published | Compare across your own hooks |
| Returning viewers | None published | Growing quarter over quarter |
| RPM | None published | Niche-dependent by 10x or more |
The pattern: benchmark against yourself, per format. Your Shorts against your Shorts. Your tutorials against your tutorials. The full treatment, including when a "low" CTR is actually a win, lives in the good CTR guide.
Advanced mode and comparisons
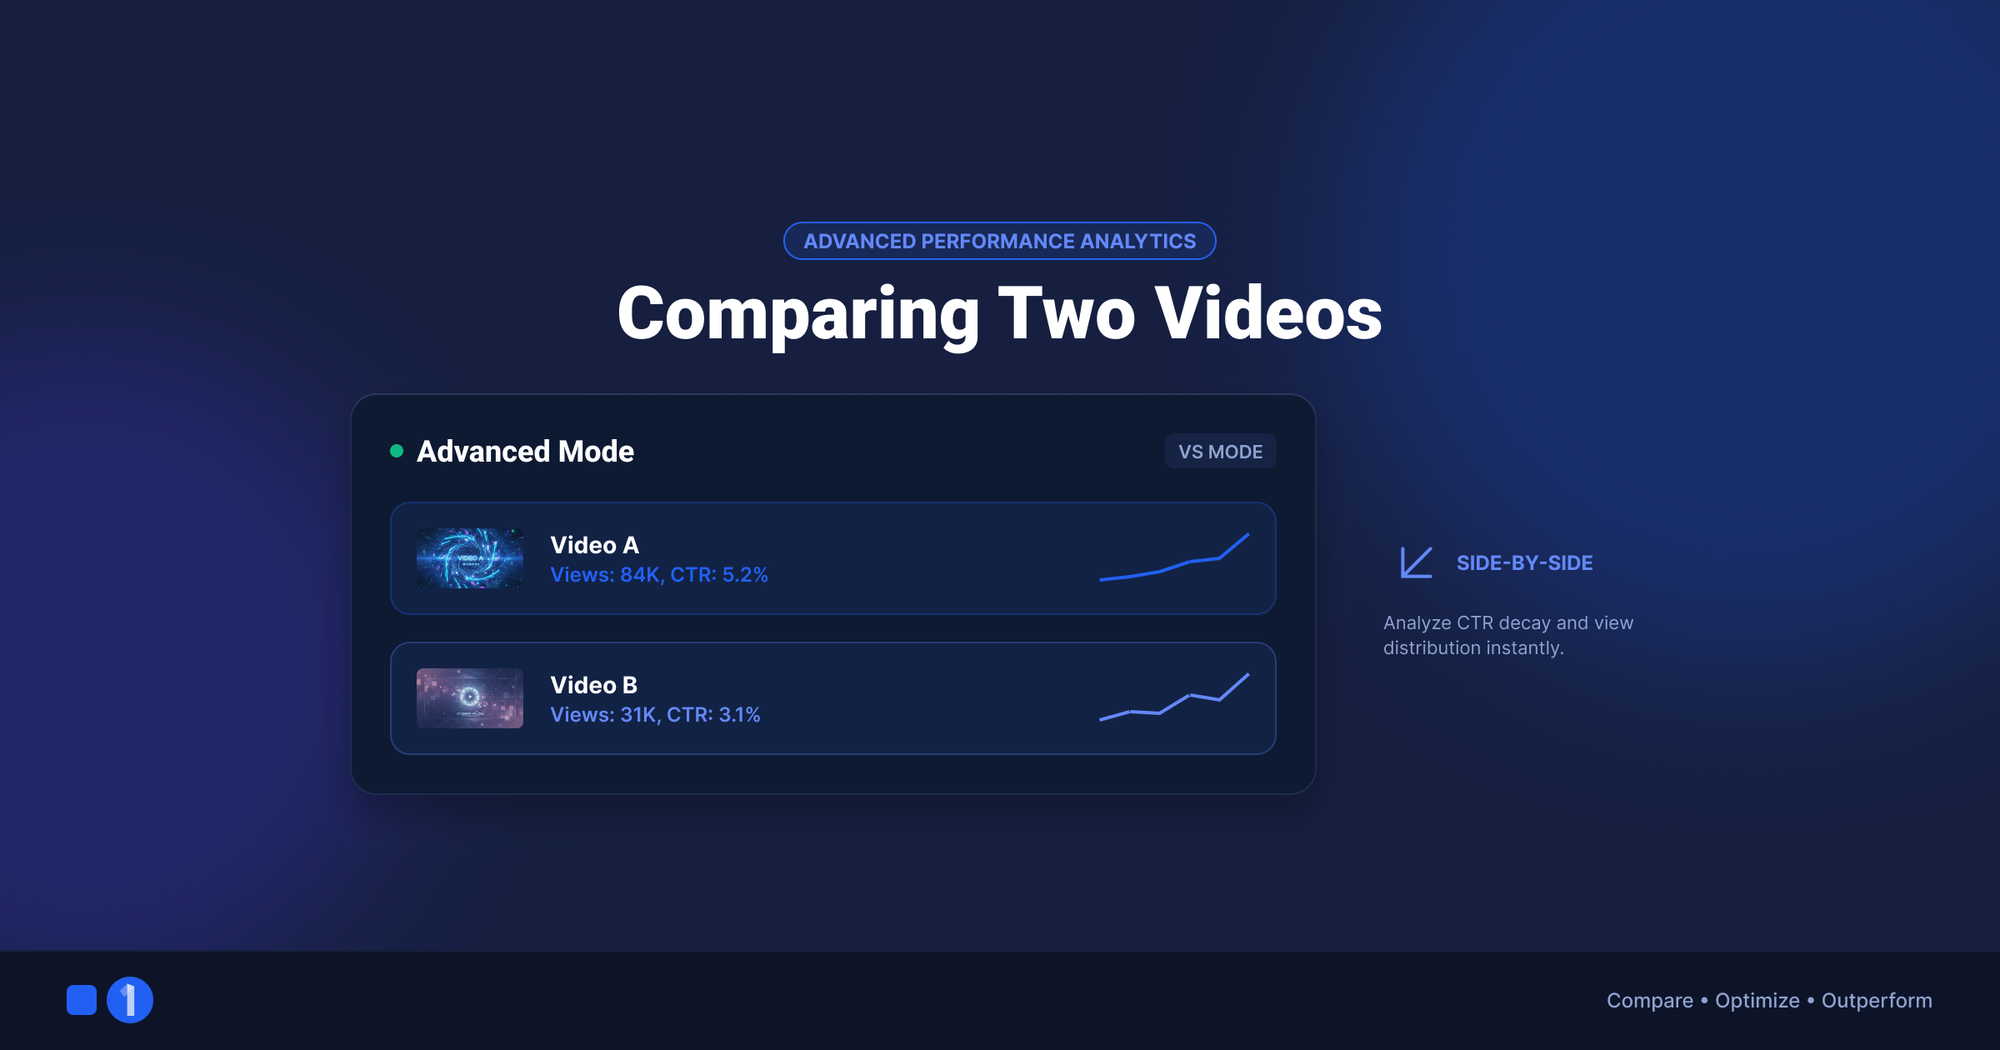
Advanced mode is the full version of YouTube Analytics: every metric, every dimension, filters, comparisons, and CSV export. Open it from the Advanced mode link at the top right of any Analytics tab on desktop, or click See more under any card.
What it unlocks that the default tabs hide:
- Compare to: run a video against another video, a date range against another date range, or a video against your channel's typical performance. This is how you test whether a new format beat the old one with data instead of vibes.
- Filters: slice any report by geography, device, traffic source, viewer type (new vs returning), or subscription status.
- Metric picker: dozens of metrics the standard tabs never surface, like impressions by specific surface or card click rates.
- Export: download CSVs for your own tracking sheet. If you run a weekly routine (below), export beats screenshots.
One workflow worth stealing: after every 5 uploads, open Advanced mode, compare the 5 against the previous 5 on CTR and AVD, and write one sentence on what changed. Ten minutes, compounding insight.
The gap: YouTube Analytics only shows YOUR data
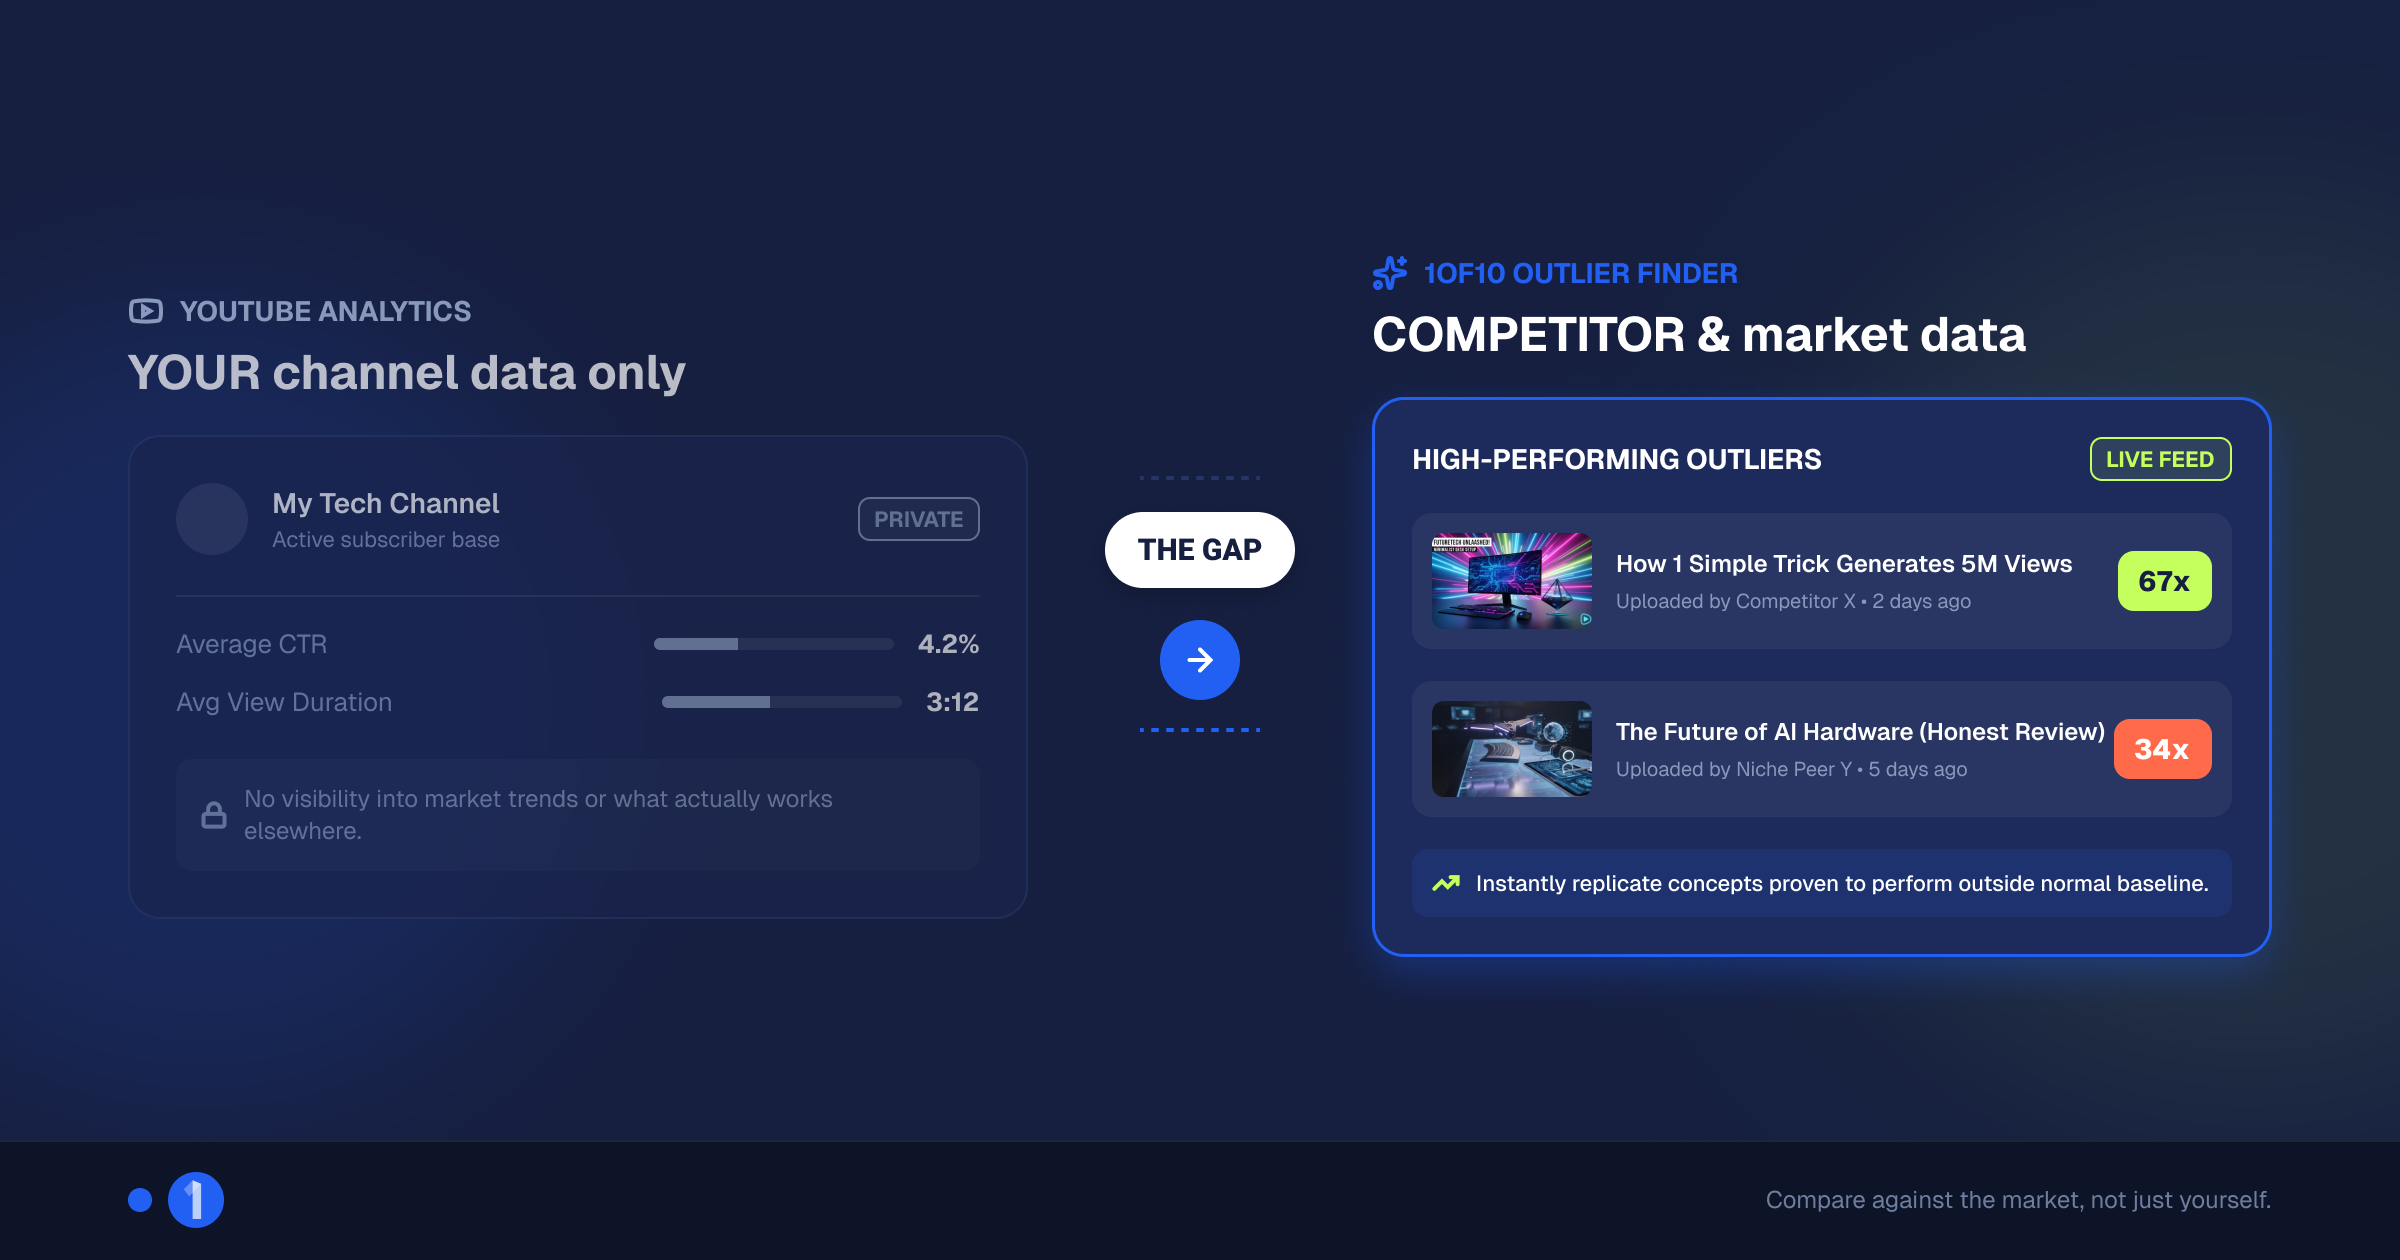
Here is the structural limit no setting can fix: YouTube Analytics reports on your channel only. It cannot tell you what is working in your niche, which competitor video just broke out, what a channel your size did to double its views, or whether your 8% CTR is beating or trailing the channels you compete with for the same audience.
That is not a small blind spot. It is half the game. Your own stats tell you how well you executed your ideas. They say nothing about whether they were the right ideas. For market data, creators use external youtube analytics sites and tools. This is exactly the gap 1of10 exists to fill:
- Outlier scores. The Outlier Finder scans millions of channels for videos performing 10x to 100x above their channel's average. An outlier score is the competitor metric YouTube will never show you: performance relative to that channel's normal, which filters out the big-channel advantage and surfaces ideas that won on merit.
- Tracked channels. Channel tracking monitors competitors and notifies you when one of their videos goes viral. Remember the "other channels your audience watches" report from the Audience tab? Those are the channels to track.
- Niche Explorer. The Niche Explorer maps topics and discovers competitor channels within a niche, which turns "what should I make next?" into a research task instead of a guess.
- Chrome extension. The 1of10 Chrome extension overlays outlier scores, rankings, and views-over-time charts directly on YouTube while you browse, including title and thumbnail change tracking with before-and-after view impact. Free tier included.
We cover the manual alternatives and workarounds in how to see another channel's YouTube analytics and how to monitor competitor subscriber growth in our YouTube subscriber tracker guide. For the DIY route, there is also finding outliers the hard way vs the fast way.
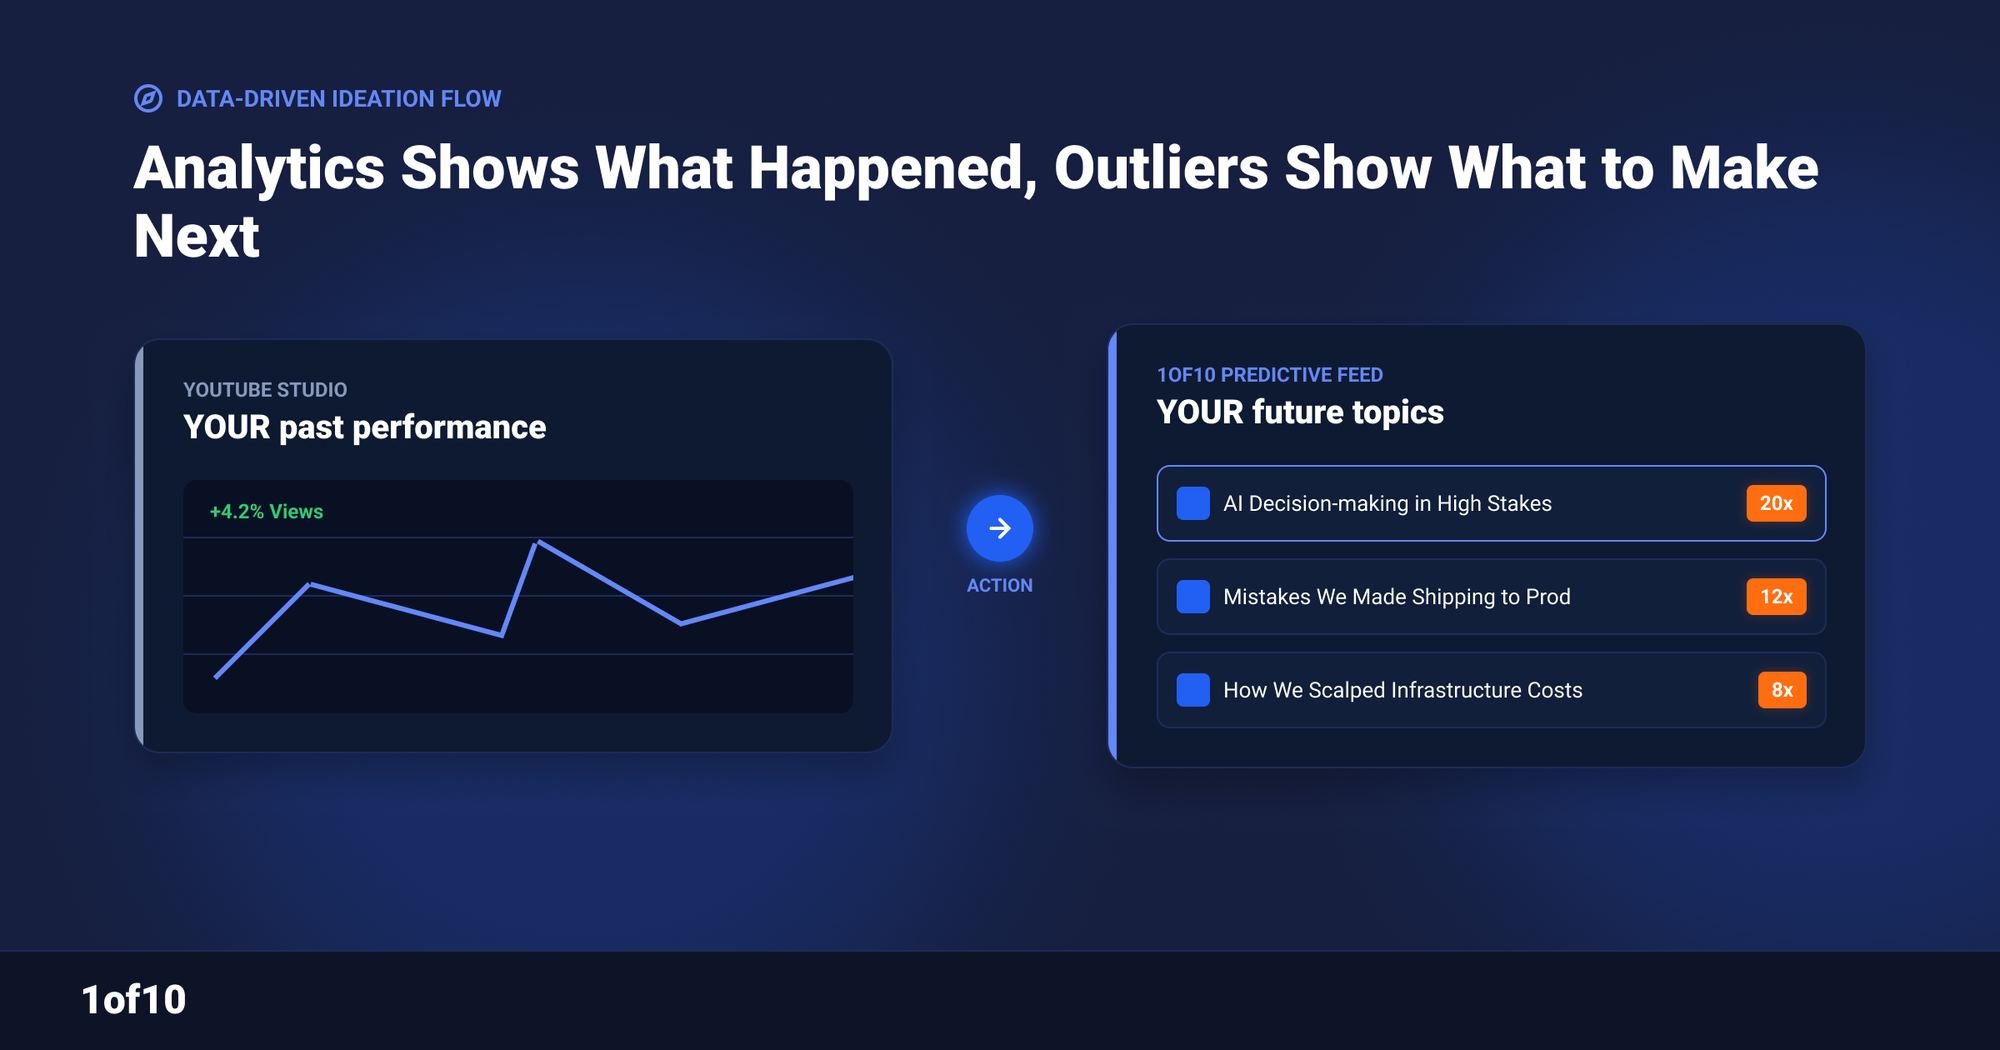
The clean mental model: YouTube Analytics for execution, external tools for direction. Studio tells you how the video did. Outlier data tells you what video to make.
YouTube analytics workflows that take minutes, not hours
Checking stats is not a strategy. Most creators either ignore analytics entirely or refresh them hourly, and both fail the same way: no decisions get made. Two lightweight routines cover everything.
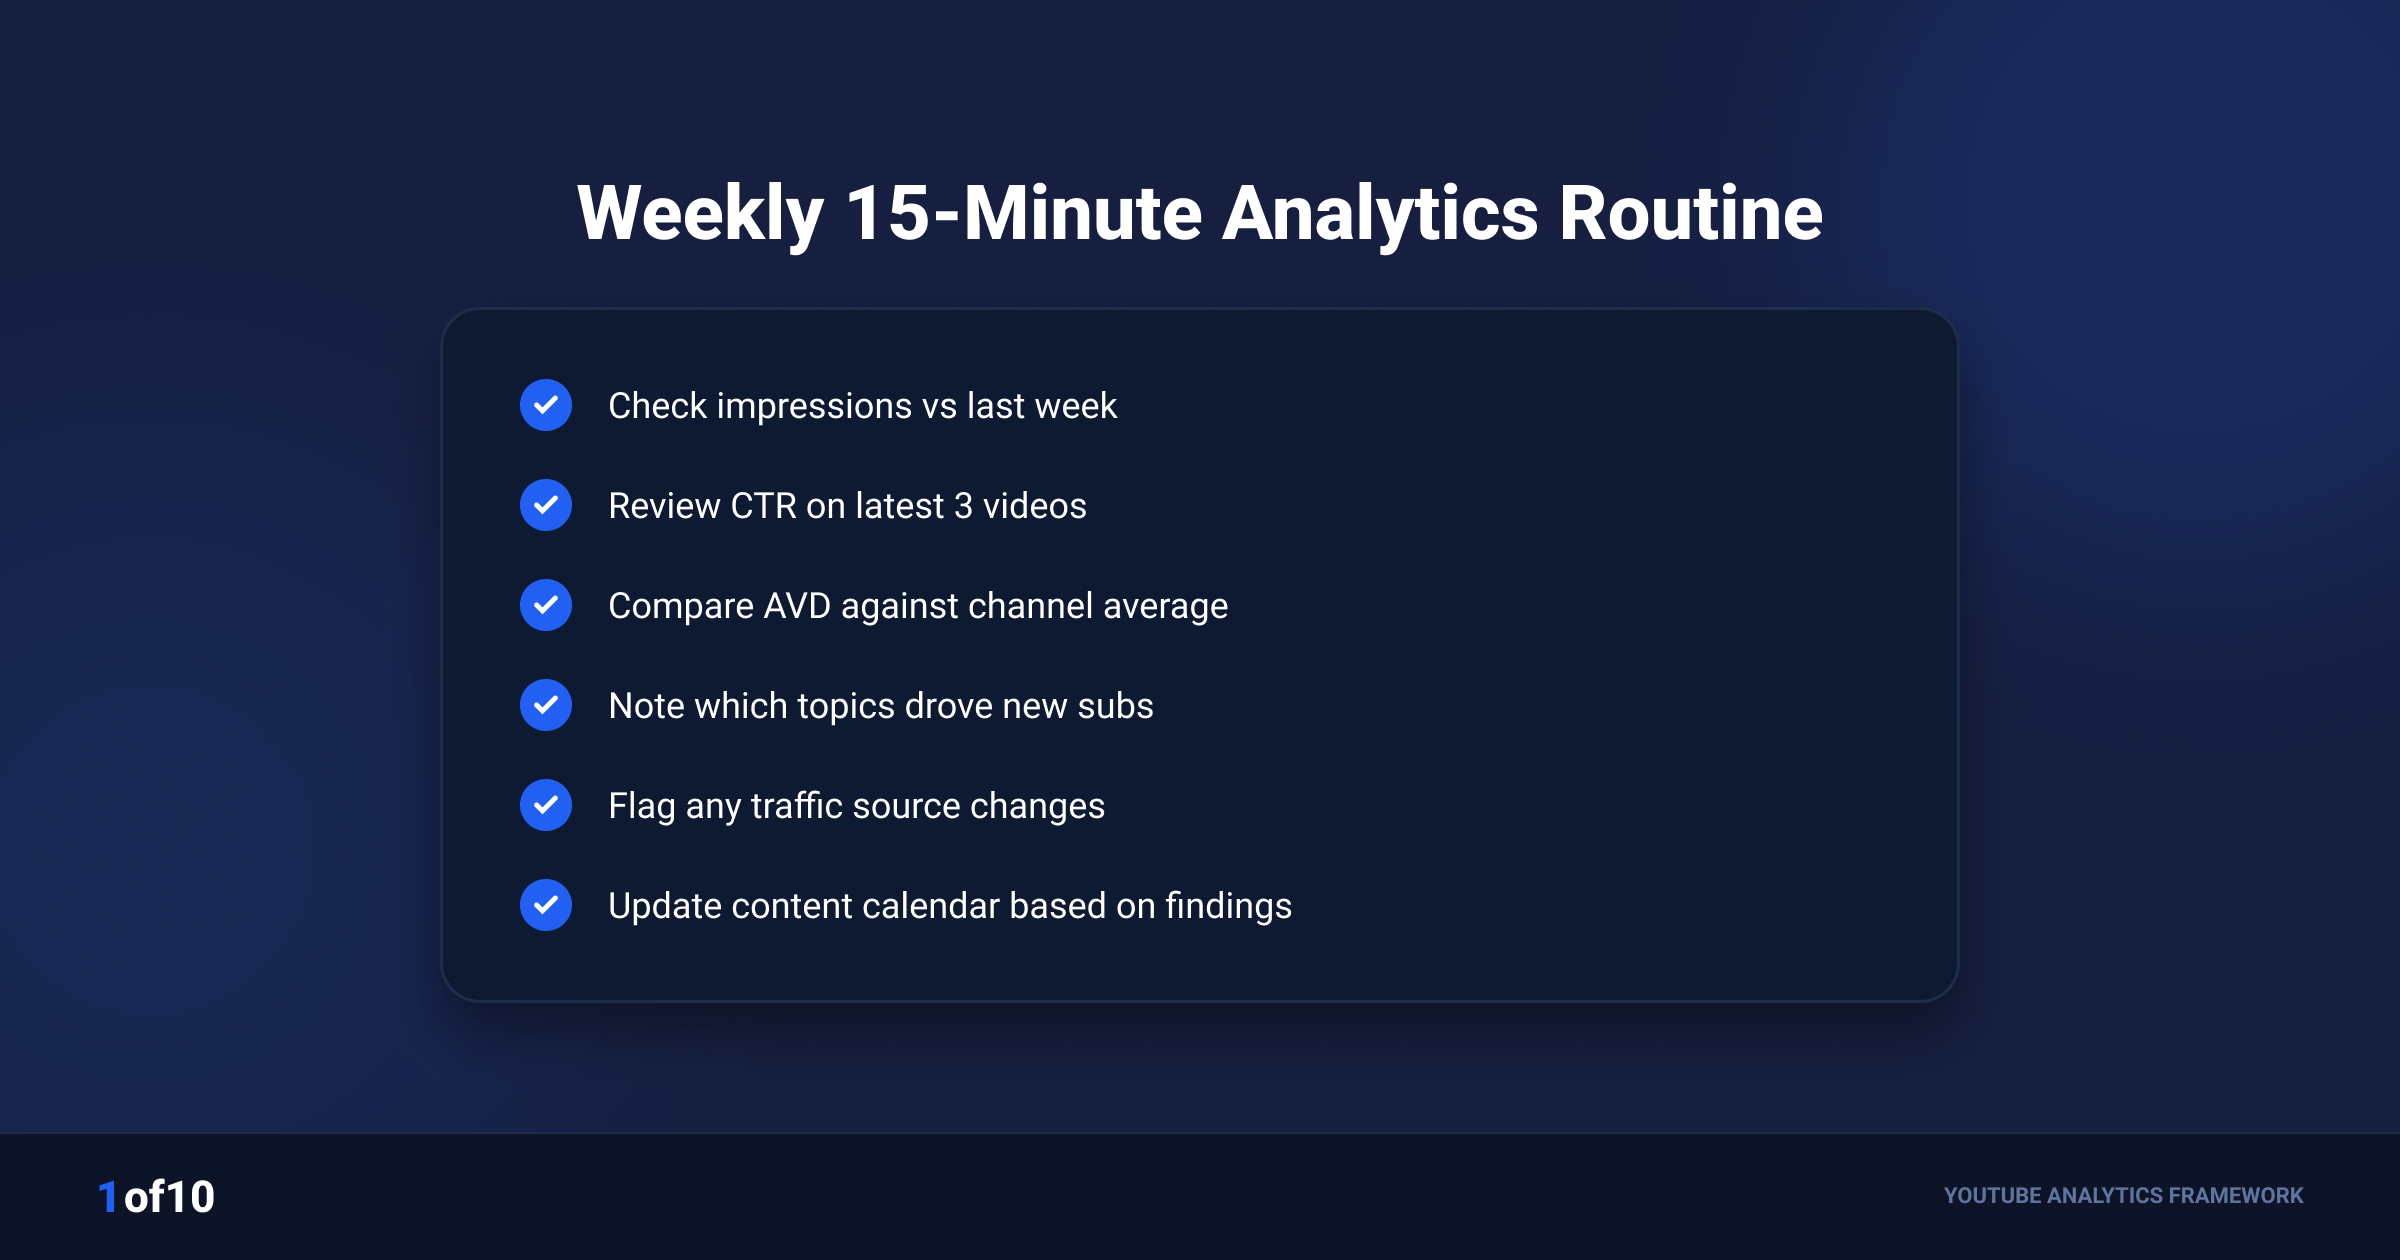
The weekly 15-minute routine
Same day every week. Timer on. Decisions out.
| Minutes | Where | What you do |
|---|---|---|
| 0-3 | Overview | Views and watch time vs previous period. Note direction, find the driver. |
| 3-7 | Content | CTR and AVD for the last 3 uploads vs channel average. Flag the weak half of the loop. |
| 7-10 | Audience | Returning vs new viewer trend. Check "other channels your audience watches" for changes. |
| 10-13 | External | Scan tracked channels and outliers in your niche for breakout videos this week. |
| 13-15 | Decide | Write one sentence: what will next week's upload do differently? |
The last two minutes are the routine. Fourteen minutes of reading with no decision at the end is entertainment, not analysis.
The post-publish 48-hour checklist
New uploads earn one focused check, not fifty anxious ones.
- Hour 1: confirm the video is live, processed in HD, with correct title, thumbnail, and end screen. Do not judge stats yet.
- Hours 2 to 6: check realtime views against your usual launch pattern, once. "Typical performance" range beats raw numbers here.
- Hour 24: first real read. CTR vs channel average, retention graph for the first 30 seconds. If the hook cliff is severe, note the fix for next time; re-editing rarely pays.
- Hour 48: traffic source check. Browse-heavy means the algorithm is testing it. If CTR is healthy but impressions stalled, packaging is fine and the topic ceiling is the issue.
- Then stop. Log it in the weekly routine and move to the next video.
More tactics for turning these reads into view growth: how to increase YouTube views.
Common ways creators misread YouTube Analytics
The dashboard is accurate. The interpretations usually are not. The five misreads below cause more bad decisions than any missing feature.
"My views dropped, the algorithm is punishing me"
No. The recommendation system does not hold grudges and does not apply channel-wide penalties for a weak video. Views drop for boring reasons: seasonality (viewership dips are cyclical), a recent video that clicked below average, topic fatigue, or simply fewer uploads. Diagnose with the loop: did impressions fall, did CTR fall, or did AVD fall? Each points to a different fix, and none of them is "the algorithm hates me." The algorithm guide covers why punishment is the wrong mental model.
Small-sample CTR panic
A video posts a 3% CTR two hours after upload on 400 impressions and the creator swaps the thumbnail. That sample is noise. Google itself notes videos under a week old or under 100 views show wide CTR variation. Give a video 48 hours minimum, several thousand impressions ideally, before judging packaging. Changing thumbnails during the first test window also muddies your own data.
Comparing AVD across different video lengths
A 4-minute AVD on a 6-minute video (67% retention) beats a 9-minute AVD on a 45-minute video (20%). Absolute AVD comparisons across formats are meaningless. Compare like with like, or use retention percentage.
Treating impressions as a quality score
Impressions measure how much YouTube is testing your video, not how good it is. They are counted on the homepage, Up Next, search, and subscription feeds, and external traffic never registers impressions at all. A video with modest impressions and strong CTR and AVD is a coiled spring, not a failure.
Watching realtime like a stock ticker
Realtime views exist to confirm nothing is broken, not to forecast anything. The first hours of a video reach mostly subscribers, the least representative audience for how the broader test will go. Check once, then close the tab.
FAQ: YouTube Analytics
How do I see my YouTube analytics?
Sign in at studio.youtube.com and click Analytics in the left menu for channel-level reports. For a single video, click Content, hover the video, and select Analytics. On mobile, open the YouTube Studio app and tap Analytics in the bottom menu. Full reports, comparisons, and Advanced mode require desktop.
What is a good CTR on YouTube?
YouTube reports that half of all channels and videos see an impressions click-through rate between 2% and 10%. There is no universal "good" number: CTR drops as impressions widen and varies by niche and traffic source. Benchmark each video against your own channel average, and only after 48 hours and a few thousand impressions.
Can you see other channels' YouTube analytics?
Not directly. YouTube Analytics is private to each channel owner. You can see public stats for youtube channels (subscribers, views, upload history) and estimate performance with external tools. 1of10's outlier scores show how any video performs relative to its channel's average, which is the closest public proxy for competitor analytics.
What is the most important metric in YouTube Analytics?
No single metric wins alone; growth comes from the loop of impressions, click-through rate, and average view duration. If forced to watch one number long term, watch returning viewers. It measures whether your content builds a habit, and channels with steadily rising returning viewers grow even through view-count dips.
How often should I check my YouTube analytics?
Once per week for 15 minutes at channel level, plus one structured check at 24 and 48 hours after each upload. Checking more often adds anxiety without adding information, since most reports update on a 24 to 48 hour delay anyway. End every session with one written decision.
What is the difference between impressions and views?
An impression counts when your thumbnail is shown to someone on YouTube (homepage, search, Up Next, subscriptions feed). A view counts when someone actually watches. Click-through rate connects them: views divided by impressions. Views from external websites or end screens do not register impressions, so the two never map perfectly.
Ready to see the half of the data YouTube hides? Your youtube channel analytics tell you how you executed. 1of10's Outlier Finder tells you what to make next, backed by millions of scanned channels. Start free, track 3 competitor channels, and get outlier scores on every video you browse with the Chrome extension.